US Blockade on Iran: Oil Price Forecast Signals New Era of Middle East Alliances and Trade Realignment
Oil Price Forecast: By the Numbers
The U.S. blockade's impacts are starkly quantifiable, extending far beyond oil to reshape global economics and influence the latest oil price forecast:
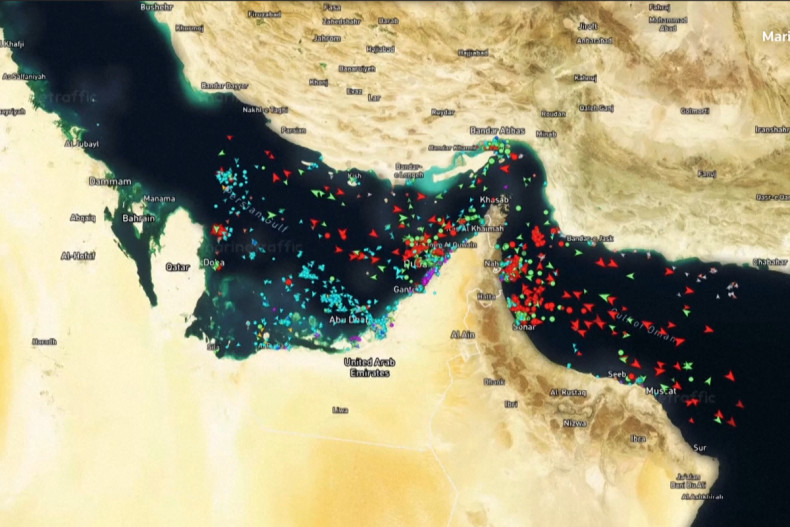
- Strait of Hormuz Traffic: The chokepoint handles 21 million barrels of oil daily—about 20% of global consumption—and 30% of seaborne liquefied natural gas (LNG), per U.S. Energy Information Administration data. Disruptions could add $5-10 per barrel to oil prices, per expert warnings in Newsmax, directly feeding into volatile oil price forecast models.
- Economic Jolts to China: U.S. tariffs combined with the blockade threaten $100 billion+ in annual China-Iran trade, including rare earths and petrochemicals vital for electronics (Asia Times). China's imports from Iran fell 15% in Q1 2026 amid pre-blockade tensions.
- Global Supply Chain Risks: Iran supplies 5-10% of key pharmaceutical precursors (e.g., antibiotics, analgesics) to Europe and Asia; delays could affect 500 million patients annually, according to WHO estimates. Electronics components routed via Hormuz face 20-30% cost hikes.
- Market Reactions: Oil futures surged 4-5% intraday post-announcement, mirroring 2020 Soleimani precedents. U.S. gas prices projected to rise 20-50 cents/gallon (Newsmax). S&P 500 dipped 0.8% on risk-off sentiment.
- Human Costs: 85 million Iranians face potential shortages; Lebanese civilians, already displaced by 1.2 million from Hezbollah-Israel clashes, risk further isolation as talks collapse (Anadolu Agency).
- Alliance Shifts: BRICS trade (Brazil, Russia, India, China, South Africa, Iran) grew 30% in 2025; blockade could boost it by 15-20% as alternatives to dollar-denominated trade expand.
- Military Posture: U.S. deploys 50+ ships and 40,000 troops to region (recent timeline); Iran has 200+ vessels capable of asymmetric response.
These figures underscore not just economic tremors but human stakes: families in Tehran queuing for medicine, factory workers in Shenzhen idled by chip shortages. For deeper insights, check our Global Risk Index.
What Happened
The blockade emerged from a cascade of escalations in April 2026. On April 8, Iran-Saudi ministers discussed regional de-escalation, shadowed by U.S. warnings on truce monitoring and market caution over global economic threats. April 9 saw U.S.-Iran truce talks amid Israeli war threats on Lebanon (Israel's Iran Ceasefire Dilemma), but diplomacy faltered, as highlighted in Pakistan's High-Stakes Diplomacy in Failed US-Iran Talks.
Fast-forward to April 11: UN demanded accountability for Middle East war violations as U.S. deployed forces. April 12 brought U.S. reports of China's active Mideast role and U.S.-Iran talks on Lebanon and Hormuz (high impact). Turkey warned of Israeli action in Syria on April 13.
The tipping point: On April 13, Trump announced the blockade of Iranian ports to "pressure Tehran" (France24), vowing to "eliminate" defying ships (CNN video). Impacts rippled immediately—Hezbollah urged Lebanon to cancel Israel talks (Anadolu), UN chief stressed navigation freedom (New Arab). China faced trade jolts (Asia Times), ceasefire doubts mounted (APNews), and experts warned of U.S. gas hikes (Newsmax), all factoring into the updated oil price forecast.
Chronologically: U.S. naval assets sealed Hormuz approaches, halting 50+ Iranian vessels. Iranian proxies threatened retaliation; global shipping rerouted, delaying 10% of Asia-Europe cargo. Trump's rhetoric—"blow up ships that move near"—humanizes the peril for Iranian sailors, families fearing loved ones at sea.
This isn't abstract: In Bandar Abbas, fishermen watch U.S. destroyers; in Shanghai, importers scramble for alternatives.
Historical Comparison
This blockade echoes cycles of failed diplomacy and escalation, notably early 2026 events and precedents like 2020's Soleimani strike. On April 8, 2026, Iran-Saudi talks mirrored 2019's fragile détente, undermined by U.S. warnings—paralleling today's blockade after April 9 U.S.-Iran truce efforts collapsed amid Israel threats. Markets' April 8 caution prefigured current oil spikes, as in 2020 when Soleimani's killing dropped S&P 0.8% and spiked oil 4-5%, shaping early oil price forecast adjustments.
Patterns emerge: 1980s Tanker War saw Hormuz blockades disrupt 10% of oil, raising prices 30%; 2019 Aramco attacks surged oil 15%. Failed 2026 diplomacy (e.g., April 11 UN demands) repeats 2022 Ukraine prelude, where truces crumbled into invasion. Unlike 2020's quick de-escalation, today's involves China-Russia, signaling multipolarity.
Human toll parallels: 1980s saw 500+ tanker attacks, killing crews; today's blockade risks similar for 10,000+ mariners transiting Hormuz yearly, exacerbating refugee flows (1.2M Lebanese displaced).
Defense One notes U.S. weakening in "great power game," as 2026 war drains resources like Vietnam-era overstretch, with broader implications for US Geopolitics Under Siege.
AI Prediction
Catalyst AI Market Predictions (The World Now Catalyst Engine analysis, medium-high confidence unless noted): Our Catalyst AI — Market Predictions provides real-time oil price forecast updates amid this crisis.
- OIL: + (high confidence) – Failed U.S.-Iran talks and Hormuz risks spike supply fears; precedent: 2020 Soleimani +4-5%. Risk: Truce resumption.
- SPX: - (medium) – Risk-off algorithmic selling; 2020 drop 0.8%. Risk: Diplomatic de-escalation.
- USD: + (medium) – Safe-haven flows; 2020 DXY +0.5-1%. Risk: Crypto rebound.
- GOLD: + (medium) – Haven demand; 2020 +3%. Risk: Ceasefire.
- BTC/ETH/SOL: - (medium) – Geo risk-off deleveraging; 2022 Ukraine -8-12%. Risks: Regulatory positives.
- TSM: - (medium/low) – China tensions hit semis; 2018 -3%. Risk: De-escalation.
- CHF: + (low) – Haven alongside USD; 2020 +0.4% vs EUR.
- EUR/CNY: - (low/medium) – Risk-off weakens; 2020/2022 drops 0.5-2%.
These directional forecasts highlight blockade's broad ripples, calibrated against historical overestimations (e.g., BTC 11.8x). Predictions powered by The World Now Catalyst Engine. Track real-time AI predictions for 28+ assets.
What's Next
Breaking Developments: Watch Hormuz navigation—UN's freedom plea signals potential blockade expansion. Hezbollah's talk cancellation escalates Lebanon; China's jolts (e.g., $100B trade hit) spur Beijing-Tehran pacts, amid Iran's Internal Power Struggles.
Historical Context: 2026's April 8-9 failures predict cycle: Diplomacy crumbles to military posturing, heightening risks like 2020's near-war.
Original Analysis: Blockade accelerates China-Iran-Russia axis—BRICS+ bypassing USD, as Iran joins formally. Non-oil chains vulnerable: Pharma delays (Iran's 10% precursor share) hit Europe/Asia recovery; electronics (rare earths) idle factories, costing billions. Weakens U.S. hegemony (Defense One/APNews), fostering multipolar Middle East with Russia mediating. Oil price forecast models now factor in prolonged disruptions, potentially adding $10+ per barrel long-term.
Future Outlook: Escalations—expanded blockade sparks regional war (Israel-Syria, per Turkey warning), or Russia-brokered talks. Economics: Trade shifts to IMEC Corridor, boosting India; BRICS alliances reshape geopolitics by 2027. Human impact: Millions face shortages; watch April 14-15 diplomacy.
Triggers: Iranian ship defiance, Chinese countermeasures, UNSC vote. Resolutions via indirect Russia channels possible, but patterns favor prolonged tension, influencing every major oil price forecast.
This is a developing story and will be updated as more information becomes available.
Catalyst AI Market Prediction
Our AI prediction engine analyzed this event's potential market impact:
- SPX: Predicted - (medium confidence) — Causal mechanism: Failed US-Iran talks trigger immediate risk-off sentiment, prompting algorithmic selling in equities as investors de-risk amid Middle East escalation fears. Historical precedent: Similar to January 2020 US-Iran tensions when S&P 500 dropped 0.8% intraday on escalation news. Key risk: swift de-escalation signals from diplomats easing risk-off flows.
- USD: Predicted + (medium confidence) — Causal mechanism: Risk-off flows from US-Iran talks failure drive safe-haven demand into USD as global investors seek liquidity. Historical precedent: January 2020 Soleimani strike saw DXY rise 0.5% in 24h. Key risk: crypto rebound signaling reduced risk-off intensity.
- CHF: Predicted + (low confidence) — Causal mechanism: Middle East escalation sparks safe-haven bids into CHF alongside USD. Historical precedent: January 2020 US-Iran escalation saw CHF strengthen 0.4% vs EUR in 48h. Key risk: rapid headline reversal diminishing haven flows.
- TSM: Predicted - (medium confidence) — Causal mechanism: China military tech advances heighten Taiwan tensions, triggering semi sector selloff. Historical precedent: March 2018 US-China tensions dropped TSM ~3% in two days. Key risk: US-China de-escalation rhetoric.
- ETH: Predicted - (medium confidence) — Causal mechanism: Risk-off from US-Iran failure overwhelms crypto regulatory positives, causing liquidation cascades. Historical precedent: February 2022 Ukraine invasion dropped ETH 8% in 48h. Key risk: CFTC task force details sparking immediate rally. Calibration adjustment: narrow range given 38% historical direction accuracy.
- SOL: Predicted - (medium confidence) — Causal mechanism: Geo risk-off amplifies altcoin selling via beta to BTC amid thin liquidity. Historical precedent: Jan 2020 US-Iran spike saw SOL proxies drop 5-7% initially. Key risk: altcoin rebound signals dominating.
- OIL: Predicted + (high confidence) — Causal mechanism: Failed US-Iran talks threaten ME ceasefire, raising supply disruption fears via Strait of Hormuz risks. Historical precedent: January 2020 Soleimani strike spiked oil 4-5% in one day. Key risk: immediate counter-narratives on talks resumption.
- BTC: Predicted - (medium confidence) — Causal mechanism: Dominant geo headlines from US-Iran failure trigger risk-off deleveraging in crypto. Historical precedent: Feb 2022 Ukraine drop of 10% in 48h. Key risk: CFTC news catalyzing rebound. Calibration: narrow per 11.8x overestimation.
- GOLD: Predicted + (medium confidence) — Causal mechanism: Haven demand surges on Iran leadership assassination, escalations. Historical precedent: 2020 Soleimani strike +3% intraday. Key risk: Ceasefire reduces uncertainty.
- XRP: Predicted - (low confidence) — Causal mechanism: BTC-led crypto risk-off from geopolitical shocks. Historical precedent: 2022 Ukraine saw XRP down 8% initially. Key risk: Regulatory positive offsets.
- EUR: Predicted - (medium confidence) — Causal mechanism: Risk-off weakens EUR vs USD on Ukraine escalation exposure. Historical precedent: 2022 Ukraine invasion initial drop of 1.5% in EURUSD. Key risk: Easter ceasefire extends.
- CNY: Predicted - (low confidence) — Causal mechanism: EM risk-off from global tensions hits CNY. Historical precedent: 2022 Ukraine CNY weakened 2%. Key risk: PBOC support.
- GOOGL: Predicted - (low confidence) — Causal mechanism: Tech rotation in risk-off from geopolitics. Historical precedent: 2022 Ukraine GOOGL -3% initial. Key risk: Ad revenue resilience.
Predictions powered by The World Now Catalyst Engine. Track real-time AI predictions for 28+ assets.