Live World Event Globe — Real-Time Global Tracking
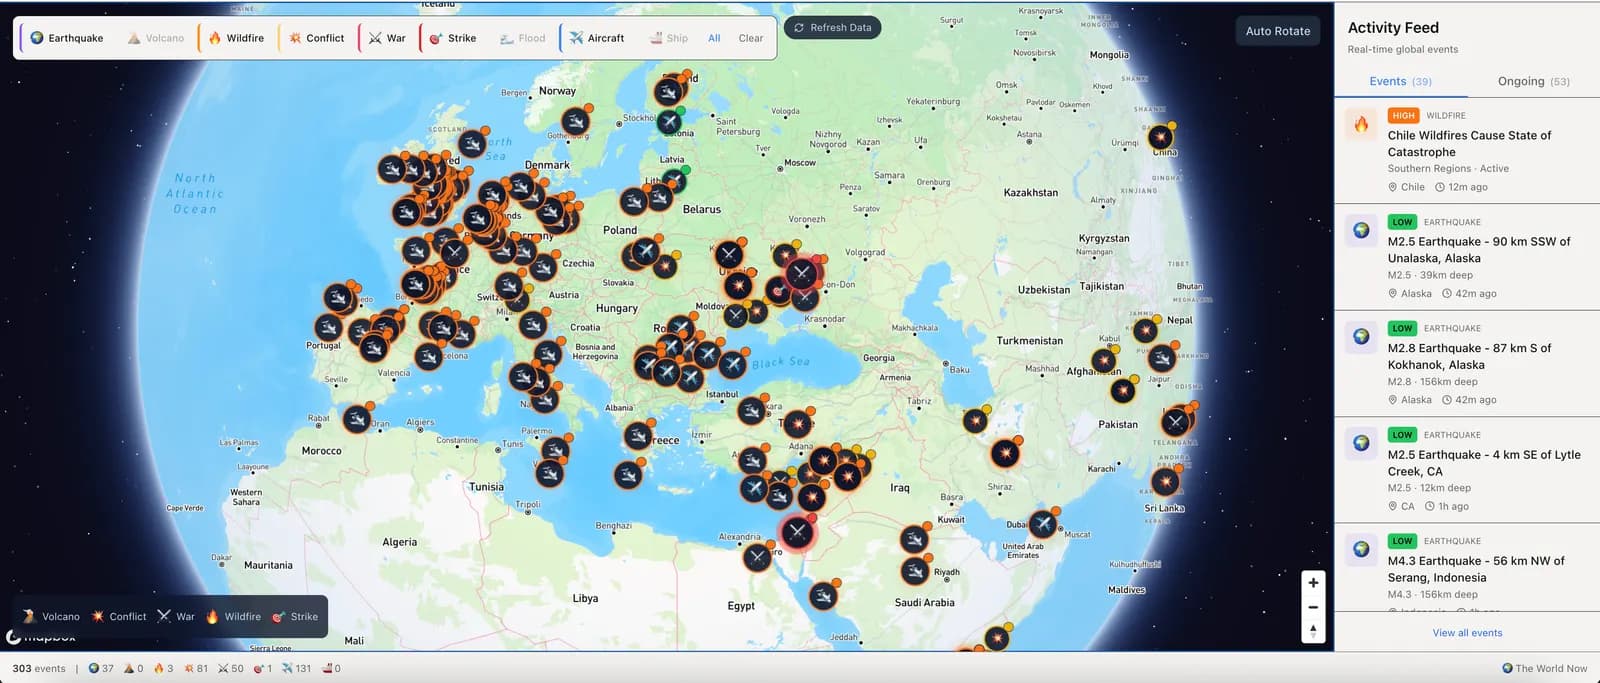
The World Now's interactive 3D globe displays global events as they unfold in real-time. Every active earthquake, volcanic eruption, armed conflict, missile strike, wildfire, flood, and severe weather event is plotted on a satellite globe with color-coded markers indicating severity. Currently tracking 4101 active events worldwide.
27
Earthquakes
286
Conflicts
84
Wars
1146
Wildfires
83
Strikes
30
Volcanoes
123
Severe Weather
49
Floods
How the Live Globe Works
Events are classified automatically from hundreds of verified sources — USGS for seismic data, NASA FIRMS for wildfire detection, ACLED for conflict events, and GDELT for global news monitoring. Each event is geolocated, severity-rated (Low, Medium, High, or Critical), and plotted on the globe within minutes of occurrence. The globe auto-refreshes every 60 seconds and supports filtering by event type (earthquakes, conflicts, wildfires, strikes, wars, severe weather, aircraft, and ships) and time range (last 24 hours, 3 days, 1 week, or 1 month).
Event Types Tracked
The globe covers ten categories of global events, each represented by distinct markers with severity-based coloring:
- Earthquakes — magnitude, depth, and aftershock tracking from USGS
- Armed Conflicts — active combat zones, clashes, and skirmishes
- Wars — major military operations and interstate warfare
- Wildfires — satellite-detected fire hotspots via NASA FIRMS
- Military Strikes — airstrikes, drone strikes, and targeted operations
- Volcanic Eruptions — active eruptions and elevated alert levels
- Floods — flash floods, river flooding, and coastal surges
- Severe Weather — hurricanes, tornadoes, typhoons, and extreme storms
Activity Feed & Event Details
The sidebar activity feed displays the most recent events sorted chronologically, each with location, severity badge, and timestamp. Clicking any event on the globe or in the feed opens a detail popup with the full description, linked news articles from verified sources, and a direct link to the event's dedicated page. Critical-severity events display a pulsing animation on the globe for immediate visibility.
Related Tools
The globe is one of several real-time monitoring tools available on The World Now:
- Earthquakes Today — dedicated seismic event tracker with regional pages
- Current Wars & Conflicts — active conflict zones and military operations worldwide
- Live World Map — embedded globe focused on real-time situational awareness
- Catalyst Market Intelligence — AI predictions connecting global events to market movements
- WW3 Map — conflict visualization with nuclear arsenal overlay
Frequently Asked Questions
What is the Live World Event Globe?
The Live World Event Globe is a free, interactive 3D map that plots real-world events — earthquakes, armed conflicts, wars, wildfires, military strikes, volcanic eruptions, floods, and severe weather — on a rotating globe as they happen. Each event is geolocated, severity-rated, and linked to verified source reporting.
How often does the globe update?
The globe auto-refreshes every 60 seconds. New events are geolocated and added within minutes of being detected by our monitoring pipeline, so the map reflects the current state of the world in near real time.
What data sources power the globe?
Events are classified automatically from hundreds of verified sources, including the USGS for seismic activity, NASA FIRMS for satellite wildfire detection, ACLED for armed-conflict events, and the GDELT Project for global news monitoring. Every event links back to its underlying source reporting.
What types of events can I track on the globe?
The globe covers ten categories: earthquakes, armed conflicts, wars, wildfires, military strikes, volcanic eruptions, floods, severe weather, aircraft, and ships. You can toggle each category on or off to focus on the events you care about.
How is event severity determined?
Each event is scored Low, Medium, High, or Critical based on type-specific signals — earthquake magnitude and depth, conflict casualty and intensity data, wildfire size, and storm strength. Critical-severity events pulse on the globe for immediate visibility.
Can I filter events by type and time range?
Yes. You can filter by event type (earthquakes, conflicts, wildfires, strikes, wars, severe weather, aircraft, and ships) and by time range — the last 24 hours, 3 days, 1 week, or 1 month — to see either the latest activity or a longer trend.
Is the World Event Globe free to use?
Yes. The Live World Event Globe is completely free, with no account or sign-up required. Open the page and the globe begins tracking global events immediately.
What is the difference between the globe and the Live World Map?
The Live World Event Globe is a 3D spherical view built for exploring events worldwide at a glance, while the Live World Map presents the same real-time event data in a flat, situational-awareness layout. Both draw from the same verified event feed — pick the globe for a global overview or the map for focused regional monitoring.