Oil Price Forecast Amid Iran's Hormuz Standoff: The Untold Impact on Emerging Global Alliances
By the Numbers
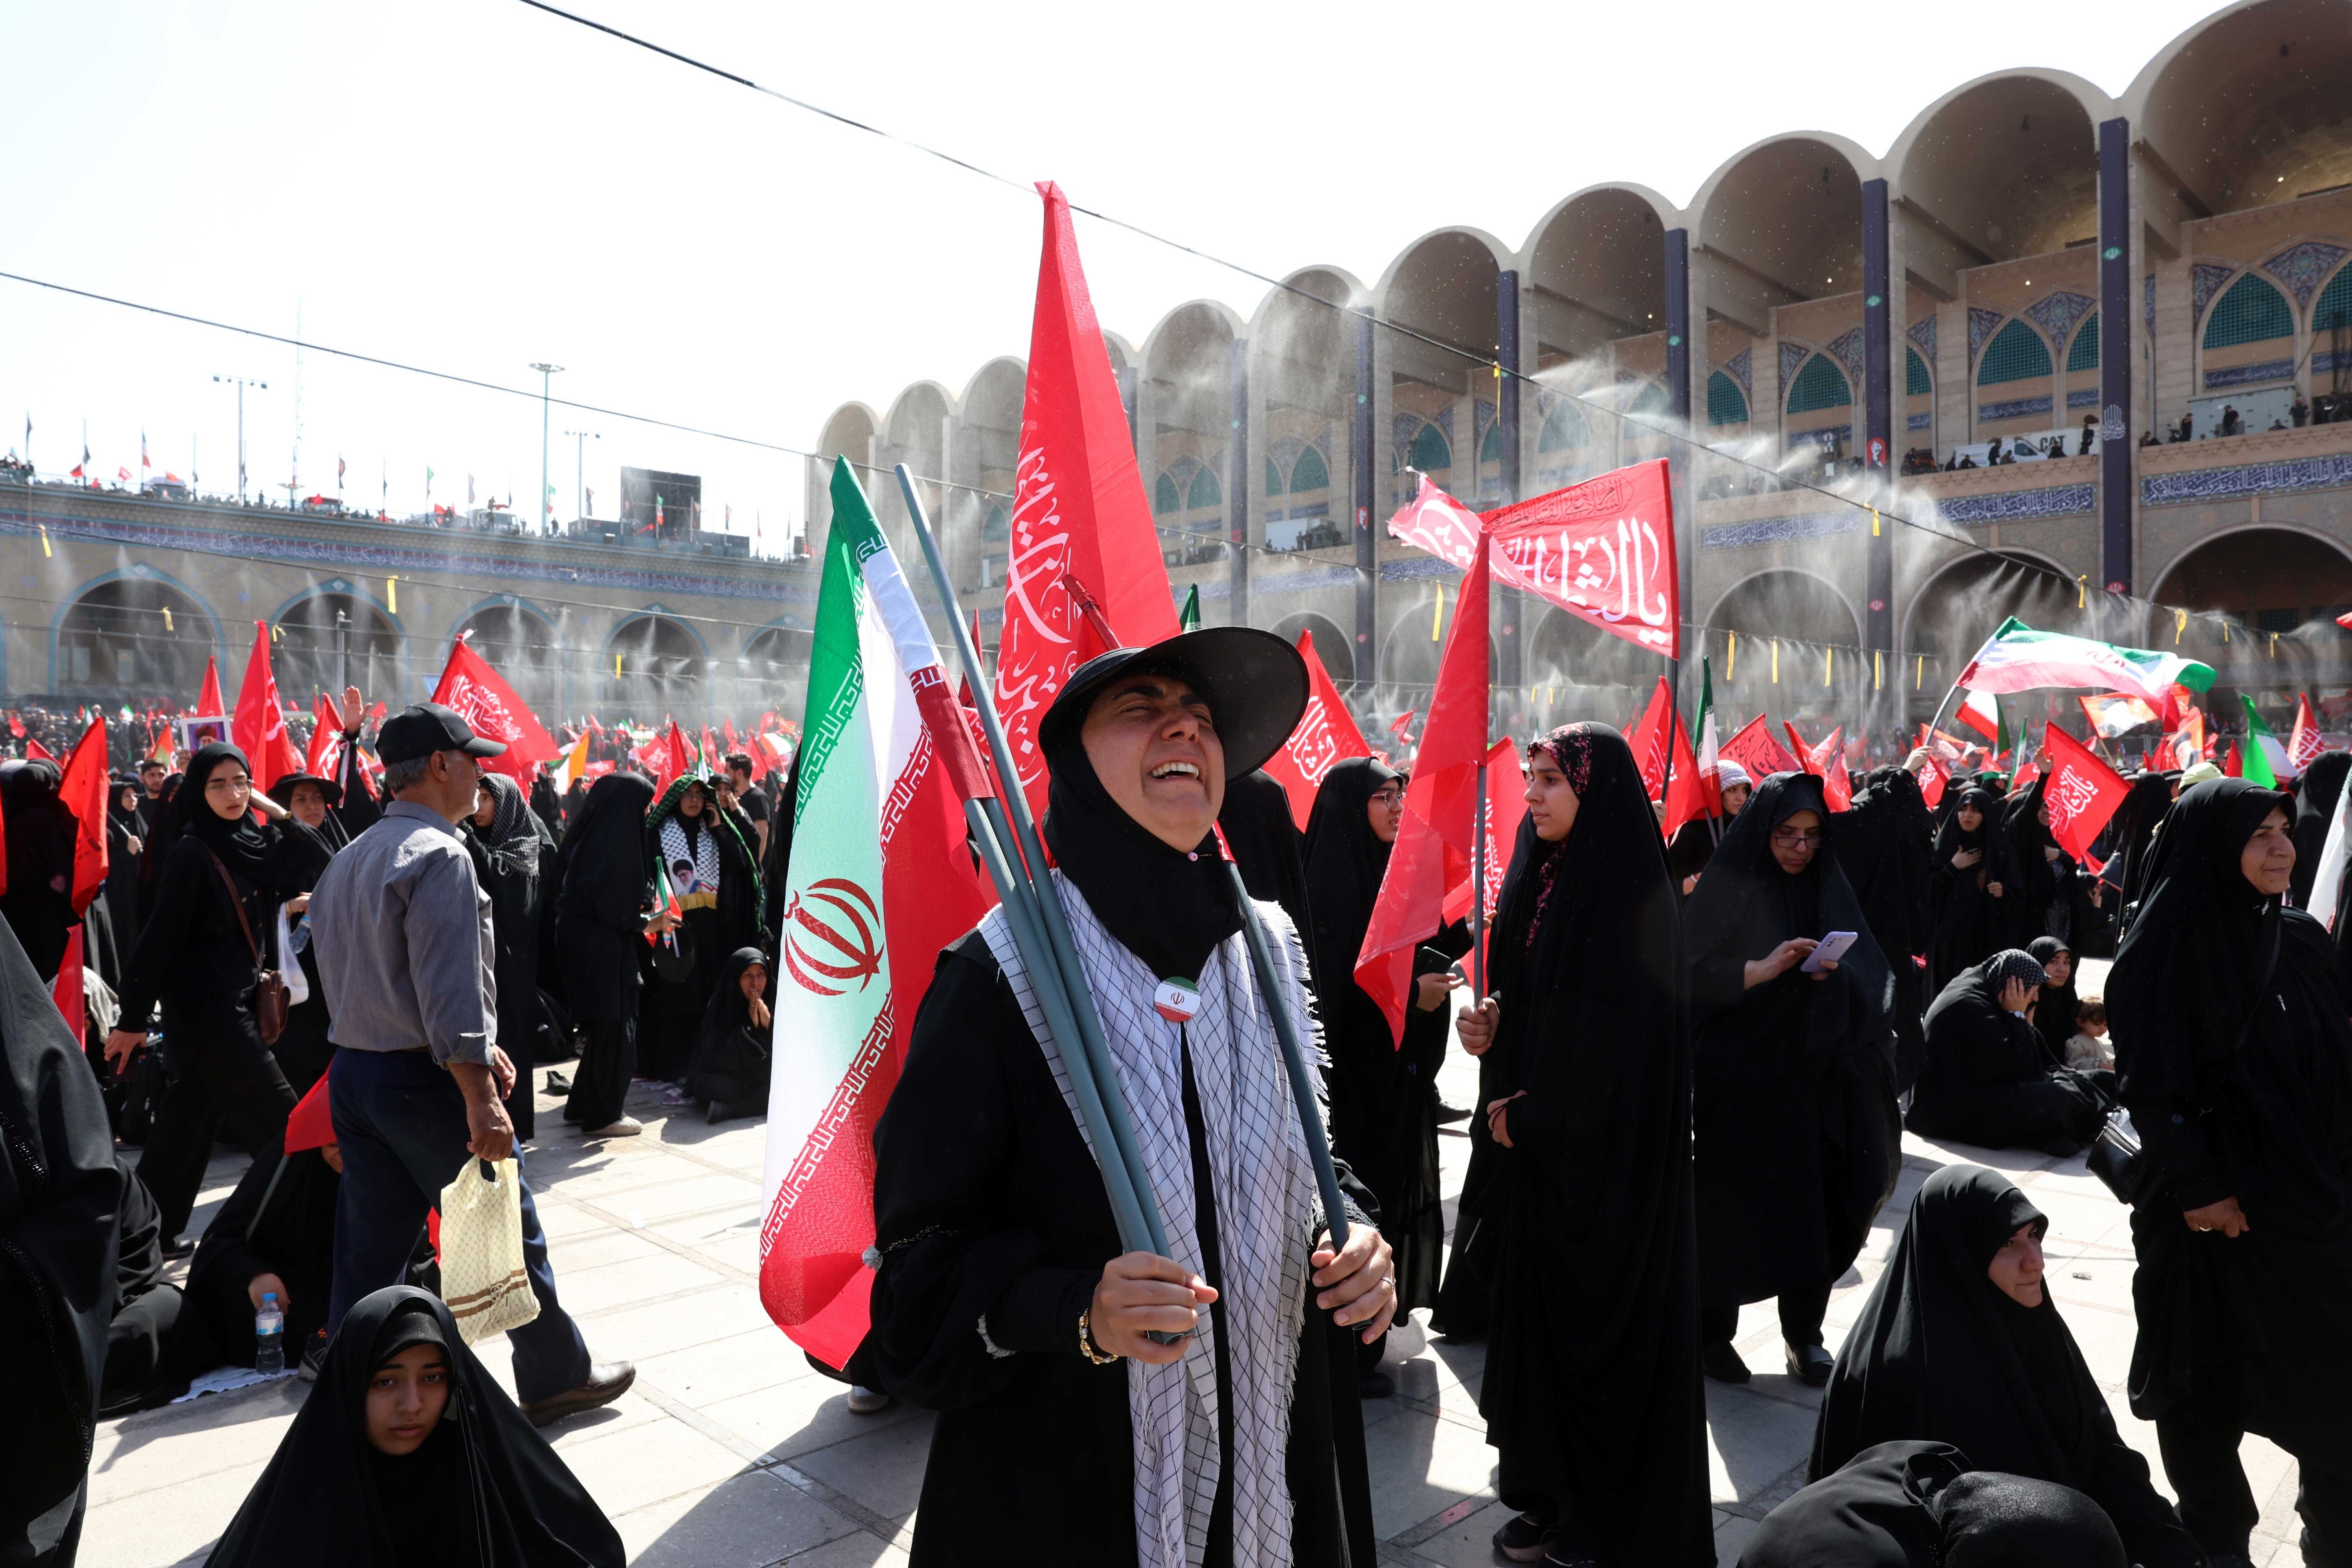
The Hormuz crisis is quantifiable in its staggering scale, underscoring why it demands urgent policy attention. The Strait of Hormuz handles approximately 21 million barrels of oil per day—roughly 20-30% of global seaborne oil trade and 25% of global LNG shipments—making any disruption a direct hit to energy security. Recent developments show oil prices slipping slightly as a handful of tankers navigated the "gauntlet" (per The New Arab), but IMF chief Kristalina Georgieva warns that prolonged conflict means "all roads lead to higher prices," potentially adding 2-5% to global inflation per IMF models from similar past disruptions. Track broader risks via our Global Risk Index.
Bahrain's Foreign Minister Abdul Latif bin Rashid Al Zayani cautioned that the war could push "millions into poverty," with initial estimates from regional think tanks projecting 5-10 million displaced or economically devastated in Gulf states alone, echoing UN projections for conflict zones. Trump's deadline—tied to April 2026 events—has already triggered market tremors: Brent crude fluctuated 3-5% daily last week, while former NATO Supreme Allied Commander James Stavridis noted Iran holds "high-value cards" like Hormuz closure, which could spike oil to $100-120/barrel, per historical precedents. See detailed projections in Oil Price Forecast: Geopolitical Shadows – The Underreported Surge of Espionage and Proxy Alliances in US-Iran Tensions.
Geopolitically, alliance shifts are emerging: China's Middle East oil imports (50% via Hormuz) face $50-100 billion annual risks, per SCMP analysis, while Russia's evacuation of its Bushehr nuclear technicians (April 2) signals deepening Iran ties amid 30% growth in Sino-Russian-Iranian trade since 2024. Crypto and equities reflect contagion: Bitcoin down 5-10% in risk-off cascades, S&P 500 vulnerable to 3-5% drops. These figures highlight policy imperatives: diversified energy routes (e.g., India's IMEEC corridor) and multilateral safeguards to prevent a multipolar realignment. Oil price forecast models emphasize these vulnerabilities, projecting sustained upward pressure on energy costs.
What Happened
The crisis unfolded rapidly, building on a timeline of escalatory rhetoric and actions from March 19 to April 7, 2026, transforming a shipping dispute into a full-spectrum confrontation with alliance ripple effects.
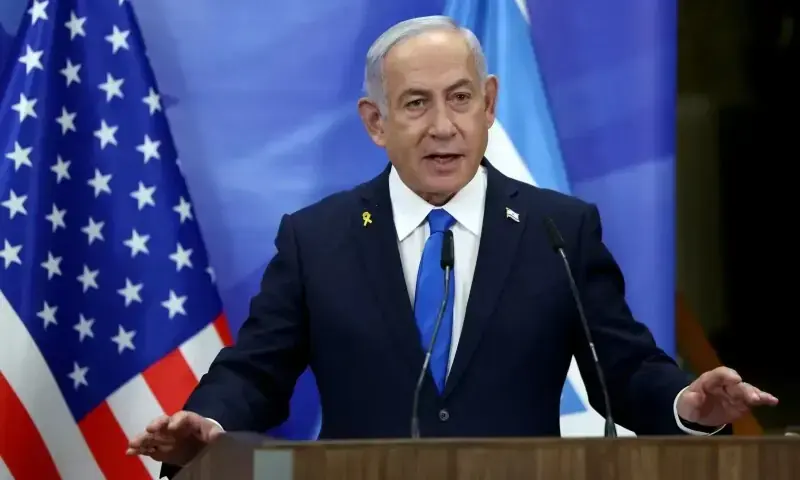
It began on March 19, 2026, when Europe—led by France and Germany—publicly backed the US position on reopening Hormuz, dismissing Tehran's blockade as a violation of international law (SCMP). This unified Western front emboldened Washington. By March 22, President Trump escalated with direct threats of strikes on Iranian power plants and infrastructure if the strait wasn't cleared, framing it as a defense of "freedom" for global trade (BBC, Newsmax). Iran retaliated the same day, vowing attacks on Middle East energy infrastructure and regional retaliation, closing the loop on a tit-for-tat cycle (timeline data).
The pace accelerated into April. On March 29, Iran accused the US of plotting attacks; March 30 saw Trump's threat to seize Iranian oil assets. April 2 marked Russia's evacuation of Bushehr nuclear plant staff, a high-signal move interpreted as protective solidarity with Tehran amid strike fears. April 3 brought French ships exiting Hormuz post-"war" tensions and an Iran-Oman monitoring plan, hinting at de-escalation probes. Trump's April 4 ultimatum was rejected outright (timeline: "Trump's Iran Ultimatum Rejected"), followed by US ceasefire strategies on April 5 that Iran dismissed, culminating in Trump's April 6-7 threats to destroy Iran "in one night" if no deal by deadline (Japan Times, Pravda, Subrayado).
Confirmed: Trump's repeated deadlines and threats (BBC, Newsmax); Iran's rejection and 10 conditions (Pravda); limited ship passages (New Arab); European support waning into "irrelevance management" critiques (SCMP); Russia's Bushehr move. Unconfirmed: Exact scale of Iranian conditions' feasibility or US strike preparations, though ex-NATO chief Stavridis affirms Iran's leverage. Social media buzz on X (formerly Twitter) amplifies this, with #HormuzCrisis trending via Iranian state accounts rejecting ceasefires and Chinese diplomats urging "restraint" while boosting Oman talks.
This chronology reveals not just military posturing but diplomatic maneuvering: Non-Western reactions—Russia's evacuation, China's implicit criticism of Europe—signal alliance reassessments, as Tehran leverages the strait to draw in counterweights to US pressure. For more on shifting alliances, explore Oil Price Forecast: Unintended Alliances – How Trump's Iran Rhetoric is Forcing Gulf States into Uncharted Neutrality.
Historical Comparison
This Hormuz standoff mirrors yet accelerates past US-Iran confrontations, revealing patterns of escalation that now hasten multipolar realignments.
Compare to 2019: After the Aramco drone attacks (claimed by Houthis, blamed on Iran), oil spiked 15% in days, Soleimani's killing followed Trump's "52 targets" threat, and DXY rose 1% on risk-off flows—parallels abound in Trump's "one night" rhetoric and market jitters. Yet 2026 differs in speed: March 19-22 saw Europe-US alignment to threats in three days, versus 2019's months-long buildup. Hormuz closure evokes 1980s Tanker War (Iran-Iraq), where 400+ ships were hit, oil doubled, but no great powers realigned; today, Russia's Bushehr role echoes its Syria intervention, pulling it closer to Iran.
Broader patterns: Post-2018 JCPOA withdrawal, US "maximum pressure" yielded asymmetric responses—Iran's 2020 Soleimani retaliation via proxies. Now, with BRICS expansion (Iran joined 2024), the crisis amplifies non-Western hedging. China's 2019 mediation attempts failed; here, SCMP notes its skepticism of French-German efforts, suggesting a pivot to Tehran for oil security (50% imports via Hormuz). Russia's post-Ukraine isolation drives energy pacts with Iran (30% trade surge). Unlike 1991 Gulf War's Western coalition, 2026 risks a Sino-Russo-Iran bloc, as Europe's "irrelevance" (SCMP) fractures unity. Policy lesson: Rapid timelines (3 days vs. months) compress decision spaces, forcing alliances like 2022 Ukraine's NATO expansions but inverted—non-West coalescing against US primacy. These historical insights inform current oil price forecast trajectories, highlighting accelerated risks.
Oil Price Forecast: Catalyst AI Market Prediction
The World Now's Catalyst AI engine, analyzing causal mechanisms from Hormuz tensions, forecasts market impacts with historical calibrations:
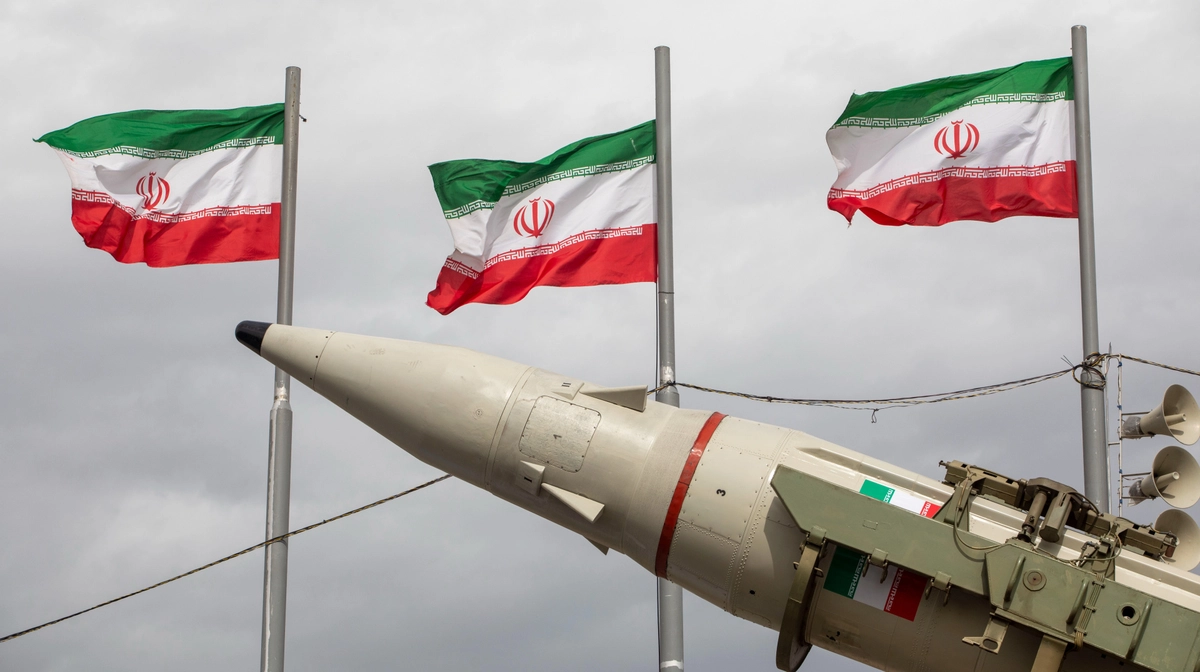
- OIL: + (high confidence) — Direct supply threats from Hormuz/Saudi intercepts tighten balances. Precedent: 2019 Aramco +15%. Risk: Non-ME output ramps.
- USD: + (high confidence) — Safe-haven flows amid geo-risk. Precedent: 2022 Ukraine DXY +2% in 48h. Risk: Central bank intervention.
- SPX: - (high confidence) — Risk-off via CTAs/equities. Precedent: 2022 Ukraine -3% week 1. Risk: Fed calming rhetoric. (Duplicates note Boeing contagion, medium confidence.)
- BTC: - (medium confidence) — Liquidation cascades as high-beta asset. Precedent: 2022 Ukraine -10% in 48h. Risk: Institutional dip-buying. (Calibrated down for overestimates.)
- ETH: - (medium confidence) — Beta to BTC risk-off. Precedent: 2022 Ukraine -8%.
- SOL/XRP: - (low confidence) — Altcoin cascades. Precedents: 2022 Ukraine drops 12-15%.
- CHF: + (medium confidence) — Safe-haven vs. EUR. Precedent: 2019 US-Iran +1%.
- EUR: - (medium confidence) — Risk-off weakness. Precedent: 2022 Ukraine -5%.
- TSM: - (low confidence) — Supply chain fears from Asia risks.
Predictions powered by The World Now Catalyst Engine and Catalyst AI — Market Predictions. Track real-time AI predictions for 28+ assets.
These projections tie Hormuz risks to broader contagion, with oil upside pressuring inflation and crypto/equity downside signaling de-risking—policy makers must monitor for alliance-driven energy shifts amplifying volatility. This oil price forecast integrates geopolitical domino effects, as detailed in Oil Price Forecast: Geopolitical Dominoes – How Middle East Tensions Are Fueling Instability in Europe and Latin America.
What's Next
The Hormuz crisis teeters on triggers that could cement new global blocs or spark wider war, demanding innovative diplomacy.
Alliance Formations (High Probability): China's Hormuz exposure (10 million bpd imports) incentivizes deeper Sino-Iran ties—expect expanded 25-year pact (2021) with joint naval patrols or CPEC extensions to Chabahar. Russia, post-Bushehr, may mediate (as in 2022 Iran-Saudi deal) while selling arms/S-400s, forming a "Eurasian energy axis" against US sanctions. BRICS+ could formalize this at 2026 summits, hedging 20% global GDP.
Escalation Risks (Medium-High): If Trump's deadline passes (unconfirmed strikes), proxy flare-ups (Houthis, Hezbollah) could engulf Red Sea-Lebanon, spiking oil +20% and displacing 10M+. Sanctions on Iran could boomerang, boosting Russia-China parallel imports (already 15% of global oil trade shadow fleet).
De-escalation Paths (Medium): Oman-Iran monitoring evolves into UN-led talks; Europe's "irrelevance" flips to shuttle diplomacy. Watch: China-Russia joint statement (trigger by April 10); US carrier movements; tanker transits (currently 50% down).
Policy Implications: US must diversify (LNG exports up 20% since 2022) and engage multipolar forums like SCO. Failure risks a "new Cold War" in energy, with Asia-Pacific economies (Japan, India) bearing $200B trade losses. Multilateral innovation—e.g., AI-monitored shipping via IMO—offers a hedge.
This is a developing story and will be updated as more information becomes available.. By Marcus Chen, Senior Political Analyst for The World Now. This analysis connects Hormuz escalations to enduring geopolitical patterns, emphasizing policy levers for alliance stabilization amid market turmoil and oil price forecast uncertainties.)*
Catalyst AI Market Prediction
Our AI prediction engine analyzed this event's potential market impact:
- SPX: Predicted - (medium confidence) — Causal mechanism: Boeing incident sparks aerospace sector sell-off with contagion to broad indices via safety concerns. Historical precedent: 2018-2019 Boeing 737 MAX crashes led SPX -5% in initial reaction. Key risk: incident downplayed by FAA probe.
- USD: Predicted + (medium confidence) — Causal mechanism: Global risk-off from Middle East geo tensions and disasters drives safe-haven flows into USD as primary reserve currency. Historical precedent: Similar to 2019 US-Iran tensions (Soleimani) when DXY rose 1% intraday. Key risk: swift de-escalation in Hormuz reduces risk-off urgency.
- TSM: Predicted - (low confidence) — Causal mechanism: Asia disaster risks (Fuji, Korea won) heighten supply chain fears for semis. Historical precedent: 2011 Fukushima caused Japanese indices -10% in a week, spilling to semis. Key risk: no actual eruption disrupts.
- SOL: Predicted - (low confidence) — Causal mechanism: Altcoin beta to BTC risk-off selling from geo headlines. Historical precedent: Feb 2022 Ukraine saw SOL -15% in 48h. Key risk: meme-driven rebound. Calibration: reduce given 34.1x overestimate.
- OIL: Predicted + (high confidence) — Causal mechanism: Direct supply threats from Saudi intercepts, Hormuz, Russia drone tighten physical balances. Historical precedent: 2019 Aramco drones spiked oil +15% in days. Key risk: no follow-through attacks.
- BTC: Predicted - (medium confidence) — Causal mechanism: Risk-off sentiment from geo tensions triggers crypto liquidation cascades as high-beta risk asset. Historical precedent: Feb 2022 Ukraine invasion when BTC dropped 10% in 48h. Key risk: dip-buying by institutions if oil stabilizes. Calibration adjustment: reduce magnitude given 11.9x overestimate history.
- XRP: Predicted - (low confidence) — Causal mechanism: Crypto risk-off cascades hit XRP as utility token. Historical precedent: Feb 2022 Ukraine BTC-led drop hit XRP -12% in 48h. Key risk: regulatory positive surprise.
- ETH: Predicted - (medium confidence) — Causal mechanism: Risk-off liquidations amplify ETH beta to BTC. Historical precedent: 2022 Ukraine ETH -8% initial drop. Key risk: staking inflows.
- CHF: Predicted + (medium confidence) — Causal mechanism: Safe-haven bid strengthens CHF amid geo risk-off. Historical precedent: 2019 US-Iran tensions CHF +1% vs EUR. Key risk: ECB hawkishness.
- EUR: Predicted - (medium confidence) — Causal mechanism: Risk-off weakens EUR vs safe havens amid Baltic/Ukraine tensions. Historical precedent: 2022 Ukraine EUR -5% in week. Key risk: ECB rate surprise.
Predictions powered by The World Now Catalyst Engine. Track real-time AI predictions for 28+ assets.