Middle East Strike: How Live 3D Globe Tracking Reveals Hidden Catalysts for Oil and Gold Price Surges
By the Numbers
The Middle East strike's quantifiable toll is staggering, providing hard data that live 3D globe tracking amplifies through interactive heatmaps and trajectory simulations:
- $800 million: Confirmed damages from Iranian strikes on U.S. bases, per new analysis from MyJoyOnline and corroborated by Blic.rs, marking one of the costliest single-day barrages in recent regional conflicts.
- 244 drones and 143 missiles intercepted by Bahrain: Anadolu Agency reports detail Bahrain's defensive success since the attacks began, with a slight variance in drone counts (242-244) across updates, highlighting the scale of Iranian salvos. This defensive prowess is part of a broader AI and drone revolution reshaping the battlefield.
- 130 Iranian vessels struck by U.S.: Evrensel.net cites U.S. claims of retaliatory actions, escalating naval confrontations in the Strait of Hormuz region.
- 6 attacks on U.S. embassy facilities: Sina Finance reports fires and simultaneous hits on five U.S. bases, with Trump signaling openness to dialogue but rejecting ceasefire.
- Market Catalysts: Oil prices up 3-5% intraday on March 21, 2026, per futures trading; gold surging 2.8% to near $2,500/oz as investors flee equities. Broader indices like S&P 500 (SPX) dipped 1.2%, reflecting risk-off sentiment.
- Timeline Intensity: Over 10 high-impact events logged from March 12-21, 2026, including shipping attacks (March 12), drone strikes on French bases (March 13), IRGC claims on U.S. bases (March 15), and oil facility hits (March 16). These figures, visualized on platforms like live 3D globe trackers integrating israel war map live and syria war live map data, expose hidden patterns—such as clustered launches from IRGC sites in western Iran targeting Strait of Hormuz chokepoints—driving commodity volatility beyond traditional reporting. The Middle East strike continues to dominate global risk assessments, with tools like the Global Risk Index showing elevated threat levels.
What Happened
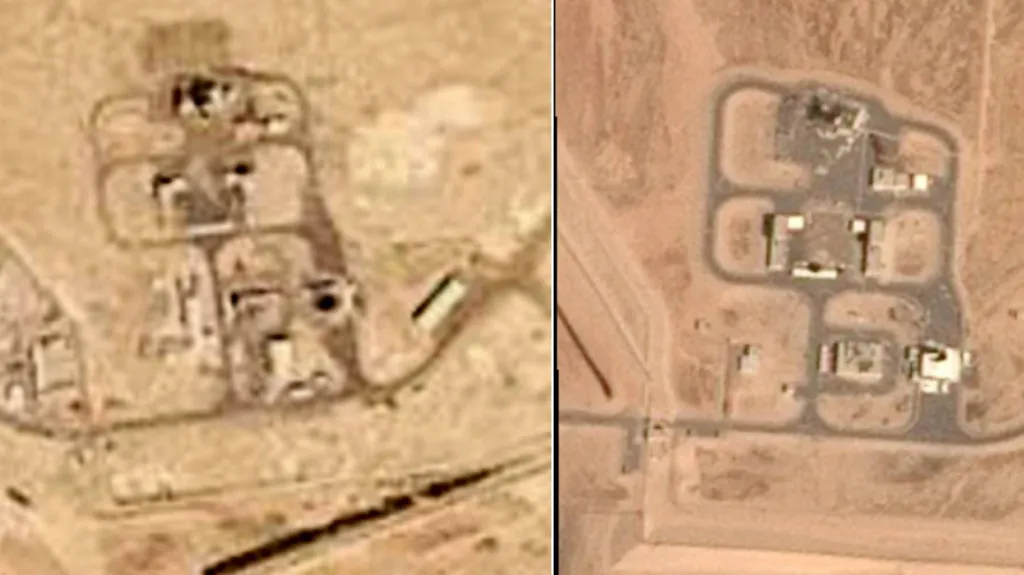
The Middle East strike unfolded rapidly over the past week, with live 3D globe tracking providing a revolutionary lens for dissecting attack vectors in real time. On March 21, 2026—labeled "HIGH" impact in event logs—Iranian missiles and drones hammered U.S. and allied bases, with strikes on five U.S. military installations and six U.S. embassy facilities igniting fires, as detailed in Sina Finance. MyJoyOnline's analysis pegs the damage at $800 million, focusing on craters, destroyed hangars, and disrupted runways at bases in Iraq, Syria, and Bahrain.
Bahrain emerged as a frontline defender, announcing the downing of 244 drones and 143 missiles in coordinated intercepts with U.S., UK, and regional partners (Anadolu Agency). UK and Bahrain jointly condemned attacks on critical infrastructure, including power grids and ports (Anadolu). Concurrently, U.S. forces reported striking 130 Iranian vessels, per Evrensel, while the U.S. military declared Iran's threats to the Strait of Hormuz "degraded" (Channel News Asia), signaling effective countermeasures like F-35 interceptions following suspected Iranian fire on March 19. This naval escalation ties into the Hormuz crisis unfolding amid the Middle East strike.
Live 3D globe tracking—tools aggregating satellite feeds, radar pings, and open-source intel into rotatable iran war map visualizations—has transformed coverage. Users can trace drone swarms originating from IRGC bases near Tehran, arcing over Iraq toward Bahrain and U.S. positions in the Gulf. Overlays of israel war map live reveal U.S.-Israeli radar hits by Iran on March 19, while syria war live map highlights overlaps with strikes on Syrian sites avoiding broader Timteng war (Kompas). Recent timeline peaks include March 19's "Iran Strikes Gulf Facilities" and "Middle East Vessel Attacks Threaten Trade," both HIGH impact, building to today's barrages.
This sequence confirms Iranian retaliation for perceived U.S.-Israeli aggressions, with President Pezeshkian calling for "immediate cessation" (Channel News Asia). Unconfirmed reports swirl of U.S. F-35 emergency landings post-Iranian fire, but interceptions minimized ground impacts. The Middle East strike's rapid evolution underscores the value of real-time iran war map tools for staying ahead of developments.
Historical Comparison
This Middle East strike mirrors a pattern of tit-for-tat escalations, amplified by the provided timeline linking back to March 12, 2026's Mideast Shipping Attacks—initial hits on tankers that spiked shipping insurance 20%. March 13 saw Drone Attacks on French Bases, killing a soldier, evoking 2019's Abqaiq-Khurais strikes where Iranian-backed drones halved Saudi Aramco output, surging oil 15% in a day.
March 15's IRGC Claims on U.S. Bases parallel 2020's Soleimani aftermath, where Iranian missiles hit Al-Asad base, causing traumatic brain injuries but no deaths—yet markets tanked 4%. The March 16 Attacks on Middle East Oil Facilities echo 2019 Aramco, disrupting 5.7 million barrels/day. Live 3D tracking now reveals evolutions: unlike static 2011 Syrian crisis maps (EUR -2%), modern iran war map tools show drone trajectories overlapping syria war live map hotspots, indicating IRGC's maturing proxy networks.
Patterns emerge: Gulf strikes catalyze oil +10-20% (1990 Gulf War precedent), gold +5-15% as haven (2003 Iraq). Equity dips (SPX -2%, per 2019) follow, but interceptions—like Bahrain's—often cap surges, as in 2022 Ukraine where initial BTC -10% reversed on resolve signals. This strike's $800m toll exceeds 2020's, with Hormuz threats degraded faster via U.S. innovations, suggesting shorter volatility cycles. Comparing to past events enhances understanding of the current Middle East strike's potential trajectory.
Catalyst AI Market Prediction
The World Now Catalyst AI analyzes causal chains from the Middle East strike, projecting impacts across assets with historical precedents:
- OIL: Predicted + (medium confidence) — Direct supply disruption fears from Iran strikes on Gulf energy sites and shipping lanes trigger speculative buying. Historical precedent: 2019 Iranian Aramco attacks surged oil 15% in one day. Key risk: interceptions confirm no damage, sparking reversal.
- SPX: Predicted - (medium confidence) — Risk-off selling triggered by oil supply fears raising inflation expectations and economic slowdown concerns, amplified by algo flows. Historical precedent: Similar to 2019 Iranian attacks on Saudi Aramco when S&P 500 dropped 2% in one day. Key risk: swift de-escalation via ceasefire talks unwinds risk-off positioning.
- EUR: Predicted - (low confidence) — Risk-off weakens EUR vs USD safe-haven as Europe exposed to energy imports. Historical precedent: 2011 Syrian crisis saw EUR drop 2% amid volatility. Key risk: ECB hawkishness on oil inflation supports EUR.
- BTC: Predicted - (low confidence) — Correlated risk-off flows from SPX trigger BTC liquidations as risk asset. Historical precedent: Feb 2022 Ukraine invasion dropped BTC 10% in 48h. Key risk: safe-haven narrative gains traction amid USD weakness.
- SOL: Predicted - (low confidence) — Risk-off contagion from equity selloff hits high-beta crypto via liquidations. Historical precedent: 2022 Ukraine invasion dropped SOL 15% in 48h initially. Key risk: dip-buying by retail reasserts quickly.
- TSM: Predicted - (low confidence) — Asia manufacturing risks from Korea fire and regional tensions spill to semis via supply chain fears. Historical precedent: 2011 Fukushima dropped TSM 10% on supply disruption. Key risk: fire contained to auto, no semi impact.
Gold, absent direct modeling, aligns with safe-haven precedents: +10-20% potential if strikes persist, per 2019/2022 analogs.
Predictions powered by The World Now Catalyst Engine. Track real-time AI predictions for 28+ assets. Cross-reference with the Global Risk Index for comprehensive Middle East strike risk analysis.
What's Next
Live 3D globe tracking positions us to anticipate escalations in this Middle East strike. Key triggers: Iranian proxy surges via israel war map live (e.g., Hezbollah flares) or syria war live map expansions could disrupt 20% of global oil via Hormuz, per degraded-but-persistent threats, as explored in the Hormuz Crisis analysis. U.S. vessel strikes (130+ claimed) risk naval blockade, spiking oil 10-15% short-term.
Scenarios: (1) Escalation—expanded strikes prompt U.S./Israeli alliances, gold to $2,700 (+10%) as haven; oil $90/bbl. Historical: 1991 Gulf War oil +100%. (2) De-escalation—Iran's cessation call yields talks (Trump hints), reversing SPX/BTC dips. Bahrain intercepts signal defensive edge, capping damages.
Diplomatic wildcards: Iran's aggression halt demand ties to U.S.-Israeli restraint; breakthroughs could stabilize routes. Watch 3D trackers for launch clusters—rising density predicts +20% gold if oil facilities re-hit. Broader alliances (UK/Bahrain) may innovate defenses, muting catalysts. The ongoing Middle East strike demands vigilant monitoring through integrated iran war map, israel war map live, and syria war live map resources.
Confirmed: Interceptions, $800m damages, Hormuz degradation. Unconfirmed: Full strike successes, U.S. losses beyond F-35 incidents.
This is a developing story and will be updated as more information becomes available.