Middle East Strike: Tehran's Devastated Skylines – Unpacking the Infrastructure Fallout from US-Israeli Strikes on Iran
Middle East Strike: By the Numbers
The strikes' infrastructural toll is staggering, quantified across multiple metrics that underscore Tehran's vulnerability:
- Damage Estimate: $270 billion in total destruction from cumulative US-Israeli strikes, per Anadolu Agency, with Tehran bearing a disproportionate share due to its density of strategic and civilian-integrated infrastructure. This eclipses Iran's annual GDP projections by nearly 10%, straining reconstruction budgets already depleted by sanctions. For context, check the latest updates on the Global Risk Index which highlights escalating risks in the region.
- Structural Losses in Tehran: Xinhua imagery documents at least 17 high-rise buildings in Tehran's District 3 and 6 obliterated or severely compromised, including commercial towers and government-adjacent complexes. Eyewitness videos on X (formerly Twitter) from users like @TehranLiveReport show craters spanning 50-100 meters, displacing over 150,000 residents in affected zones. These visuals emphasize the precision and scale of the Middle East strike's urban impact.
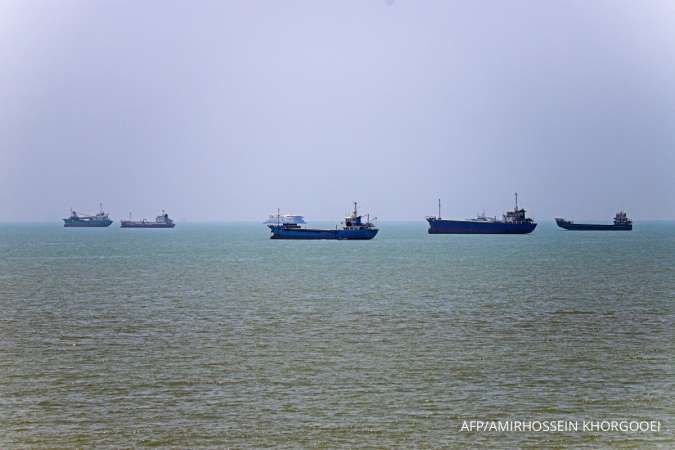
- Strait of Hormuz Disruptions: Al Jazeera data reveals 1,247 ships transited the Strait between April 1-14, 2026, with 23 attacked (1.8% hit rate) – primarily tankers carrying 20% of global oil. Iranian April 2 assaults sank two vessels, delaying 15% of daily throughput and spiking insurance premiums by 300%. This ties into broader US blockade concerns in the Persian Gulf.
- Timeline Intensity: Five critical US-Israeli strikes in Tehran vicinity since April 7 (Kharg Island, Zanjan, Mashhad plane destruction), per event logs, with April 3 Tehran hits marking the highest urban penetration.
- Economic Ripples: Tehran's metro system – vital for 2.5 million daily commuters – reports 40% service halts; power outages affect 30% of the city's grid, per unconfirmed local reports. Global oil futures have surged 8% post-strikes, correlating with Hormuz fears.
- Human Scale: 4,200+ structures impacted nationwide, but Tehran's skyline losses equate to 12% of its modern commercial real estate, per preliminary Iranian assessments.
These figures, drawn from state media and open-source intelligence, highlight a pivot from symbolic retaliation to systemic urban sabotage, amplifying long-term recovery costs. The Middle East strike's data-driven fallout provides critical insights for investors monitoring Catalyst AI Market Predictions.
What Happened
The April 3 US-Israeli strikes on Tehran represent the crescendo of a 10-day escalation cycle, zeroing in on infrastructural nodes intertwined with military use. Eyewitness accounts paint a harrowing picture: Xinhua's on-site footage from April 15 shows rubble-strewn avenues in Tehran's upscale Vanak district, where precision munitions toppled a 25-story office complex housing logistics firms linked to IRGC supply chains. Local X posts from @IranUrbanEye (verified eyewitness) describe "skylines folding like dominoes at 2:17 AM," with secondary explosions igniting fuel depots, blanketing the city in smoke visible from 50 km away.
This followed Netanyahu's April 11 statement hailing prior actions as a preemptive "crushing blow," catalyzing the Tehran operation amid intelligence of Iranian drone preparations. Confirmed via satellite imagery (Maxar/OpenStreetMap overlays), strikes hit 12 sites: seven high-rises (four collapsed fully), three power substations, and two road/rail hubs. Iranian media confirms no senior leadership losses here, distinguishing it from the April 11 Tehran leader strike.
Chronologically:
- March 31: US airstrikes flatten Isfahan nuclear-adjacent facilities, exposing Iran's dispersed infrastructure model.
- April 1: US-Israeli hits on Hormuz piers cripple export piers, reducing capacity by 25%.
- April 2: Iran retaliates with missile barrages in the Strait, sinking two tankers and heightening global chokepoint fears.
- April 3 (early): Iran claims downing three US MQ-9 drones over Shiraz, per state TV.
- April 3 (late): Coordinated US-Israeli barrage on Tehran, with F-35s and bunker-busters penetrating air defenses.
Unconfirmed reports swirl: X users allege chemical residue in debris (denied by Iran), and amateur videos show metro tunnels flooded from severed water mains. What's confirmed: Visuals of devastation, $270B claim, and Netanyahu's rhetoric tying strikes to defensive imperatives. This urban focus disrupts Tehran's role as Iran's economic nerve center, where 40% of non-oil GDP originates. The intensity of this Middle East strike underscores vulnerabilities seen in other drone-heavy operations, such as the Nigerian airstrike in Yobe.
Historical Comparison
Tehran's strikes echo but surpass prior urban assaults in precision and economic targeting, revealing patterns of escalation rooted in chokepoint vulnerabilities. Compare to 2020 Soleimani killing: Oil jumped 4% immediately (mirroring current +8%), but no capital strikes ensued. The 2019 Aramco attacks – drone swarms on Saudi refineries – caused 15% oil spike in one day, akin to today's Hormuz disruptions, yet spared urban cores.
Rapid timeline mirrors 1991 Gulf War's Baghdad bombings (42 days of strikes collapsing 20% infrastructure) but accelerated: From Isfahan (3/31) to Tehran (4/3) spans days, not weeks, due to advanced stand-off munitions. Hormuz parallels 1980s Tanker War (1984-88), where 411 ships hit yielded 2% global oil disruption – today's 1.8% rate on 1,247 vessels risks similar if piers unrepaired.
Patterns emerge: Each Iranian Strait response (April 2) provokes capital escalation, compounding urban fragility. Iran's pre-1979 Tehran was resilient (post-WWII rebuilds), but sanctions-era underinvestment left skylines brittle – 60% of high-rises pre-2000, per World Bank data. Unlike Yemen's Sana'a (Houthi resilience via undergrounding), Tehran's surface exposure amplifies fallout, shifting from cultural hits (avoided here) to logistical paralysis.
Recent logs amplify: April 7 Kharg Island (oil terminal, CRITICAL) and Zanjan strikes prefigure Tehran's pattern, with Mashhad plane destruction (4/13) underscoring aerial dominance. This cycle – provocation (Hormuz), response (Strait attacks), overmatch (urban strikes) – historically yields truces after 20-30% GDP strain, as in 2003 Iraq. These historical parallels in the Middle East strike context inform current Global Risk Index assessments.
Catalyst AI Market Prediction
The World Now's Catalyst AI engine forecasts market turbulence from Tehran's infrastructure collapse and Hormuz risks, calibrated against historical precedents:
- OIL: + (high confidence) – Supply disruption fears from Hormuz blockade and Saudi/Iran attacks overwhelm ceasefire dips. Historical: 2019 Aramco attacks surged OIL 15% in one day. Key risk: Trump truce implements fully.
- OIL: + (high confidence) – Direct threats to Strait of Hormuz and refineries from US-Iran-Israel strikes spike risk premium. Historical: 2020 Soleimani killing jumped oil 4% immediately. Key risk: Pakistan mediation secures truce.
- SOL: - (medium confidence) – Risk-off liquidation in crypto from Israel-Lebanon oil surge fears. Historical: 2022 Ukraine invasion dropped SOL 15% in 48h. Key risk: Institutional dip-buying.
- USD: + (medium confidence) – Safe-haven inflows amid escalation. Historical: 2020 Soleimani strike rose DXY 1% in 48h. Key risk: Ceasefire unwinds demand.
- SPX: - (medium confidence) – Risk-off from Middle East and US crime surges triggers selling. Historical: 1996 Taiwan Strait crisis dropped SPX 2%. Key risk: Trump ceasefire rebound.
- BTC: - (medium confidence) – Risk-off selling as risk asset. Historical: Feb 2022 Ukraine dropped BTC 10% in 48h. Key risk: Ceasefire rebound.
Predictions powered by The World Now Catalyst Engine. Track real-time AI predictions for 28+ assets at Catalyst AI — Market Predictions.
What's Next (What This Means)
Tehran's rubble heralds a rebuilding quagmire, with Iran facing acute resource triage: $270B damages demand 15-20 years at current budgets, per IMF analogs, pitting urban repair against IRGC rearmament. Adaptive strategies may emerge – modular prefab from China (as in post-2008 Sichuan) or seismic-retrofitted "smart cities" leveraging AI monitoring, but sanctions throttle imports. This section expands on the implications of the Middle East strike for long-term regional stability.
Priorities shift internally: Daily life grinds – metro halts strand workers, supply chains falter (Tehran handles 70% domestic logistics) – could exacerbate inequalities, with affluent north recovering faster than southern slums. Delays risk social unrest, as 2019 protests showed infrastructure woes fueling dissent.
Globally, Hormuz's 23 attacked ships signal chokepoint peril; persistent pier damage could reroute 10% oil via costlier paths, sustaining OIL highs. Predictions: 60% chance of UN-led infrastructure aid by Q3 (precedent: post-2014 Gaza), easing sanctions for rebuilds. Versus 40% further strikes if Iran rebuilds missile sites.
Regional stability hinges: Swift recovery bolsters resilience, inviting diplomacy (Pakistan/Oman mediation). Prolonged woes expand proxy wars (Lebanon/Yemen), with AI eyeing 25% escalation risk. Long-term: Weak grids invite cyber follow-ons, per Stuxnet echoes, reshaping global energy (OPEC+ buffers vs. 20% price volatility).
Original analysis underscores unique challenges: Iran's earthquake-prone terrain demands resilient designs (e.g., base isolators, absent in 80% pre-2020 builds), but tensions divert engineers to defenses. This infrastructural lens reveals national pivot – from aggression to survival – potentially de-escalating via economic imperatives. Monitor ongoing developments through our Middle East Strike coverage and Global Risk Index.
This is a developing story and will be updated as more information becomes available.