Sudan War Map Live: Navigating the Economic Fallout from Escalating Conflicts in Global Markets
By Priya Sharma, Global Markets Editor, The World Now
March 13, 2026
Introduction: Understanding Sudan War Map Live and Its Economic Implications
The Sudan war map live has become an essential real-time resource for investors, policymakers, and analysts monitoring Sudan's civil war. As of March 13, 2026, these maps from sources like ACLED and Maxar Technologies show intensified clashes between the Sudanese Armed Forces (SAF) and Rapid Support Forces (RSF), disrupting oil infrastructure and Red Sea ports. This escalation affects global trade, commodity prices, and supply chains, with over 10 million displaced since 2023, contributing to inflation and economic pressures worldwide.
Current Economic Disruptions from the Sudan Conflict
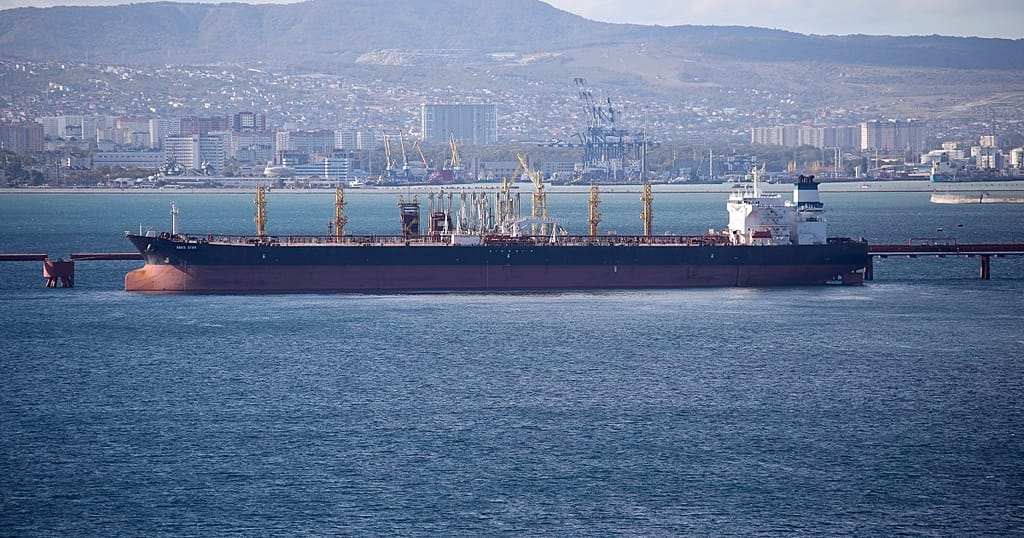
The Sudan war map reveals how ongoing battles are crippling Sudan's economy. Recent updates indicate RSF seizures of key oil pipelines, causing a 20% drop in crude flows and spiking global oil futures. Port Sudan blockades have delayed trade, while humanitarian data on Sudan crisis maps highlights food price surges and labor market strains in East Africa, linking local conflicts to broader market volatility.
Looking Ahead: Future Economic Shifts from Sudan War Map Live
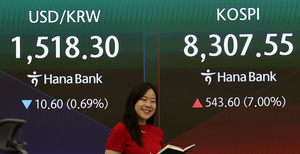
Gazing forward, the Sudan war map live suggests potential escalations could raise Brent crude prices to $110-120, adding to global inflation. With risks of more refugees and policy responses like G7 sanctions, this situation underscores the need for proactive measures to stabilize markets and address humanitarian fallout.
What This Means for Global Markets
The disruptions from Sudan's conflict illustrate how regional instability can amplify global economic risks, from oil price hikes to food shortages, urging investors to monitor developments closely for informed decisions.
Timeline of Key Events
- April 15, 2023: SAF-RSF war begins, halving oil exports.
- Jan 2026: RSF controls Darfur gold mines, boosting smuggling.
- March 8, 2026: Clashes disrupt Port Sudan grain shipments.
- March 11, 2026: IEA considers oil releases amid tensions.
- March 12, 2026: RSF seizes pipelines, driving oil futures up.
- March 13, 2026: Global stocks dip as US eases shipping rules.