Iran War Intensifies: Real-Time 3D Globe Tracking Exposes Hidden Environmental Toll and Catalyst Forecasts on Oil Prices
Iran War Story
The Iran war, now a full-scale confrontation pitting the US-Israel alliance against Tehran, has rapidly escalated from proxy skirmishes to direct, high-intensity operations. On March 18, 2026—day 19 of the campaign—satellite imagery and advanced real-time 3D globe tracking platforms, such as those integrated into tools like Google Earth Engine and proprietary military visualization systems, have pierced the fog of war to reveal unprecedented environmental damage. Confirmed reports from the Korea Herald detail satellite images showing massive oil spills from struck tankers in the Strait of Hormuz, with dark plumes spreading over 50 square kilometers of vital waterway, as explored in "Iran's Hormuz Standoff: The Overlooked Environmental Catastrophe Brewing in the Persian Gulf". These visuals, corroborated by Al Jazeera and CNN updates, depict not just military targets like Iran's Kharg Island oil facilities—hit in a pivotal Iran strike on March 13—but also collateral habitat destruction: mangrove forests obliterated, coral reefs smothered in crude, and desalination plants crippled, contaminating freshwater supplies for millions.
This narrative unfolds against a backdrop of tactical precision strikes turning ecologically disastrous. Dawn.com outlines the Strait of Hormuz blockage, where Iranian mines and sunken vessels have halted 21 million barrels of daily oil transit, leading to floating debris fields visualized in 3D models as sprawling pollution zones. Airlines, per Cyprus Mail, have canceled over 200 flights into the region, stranding 50,000 passengers amid fears of missile interceptions. The 3D tracking—leveraging multispectral satellite data from sources like Planet Labs and Maxar—rotates the Persian Gulf into a dynamic Middle East war map, layering strike impacts over bathymetric charts to show how underwater oil plumes are poisoning fisheries that sustain 10 million livelihoods. This is no mere sidebar; it's a strategic revelation, as environmental monitoring NGOs like the Environmental Defense Fund have noted early die-offs in marine life, with algorithmic predictions forecasting a 30% biodiversity loss in the Gulf by summer. The integration of such Middle East war map tools provides unprecedented visibility into the Iran war's far-reaching consequences.
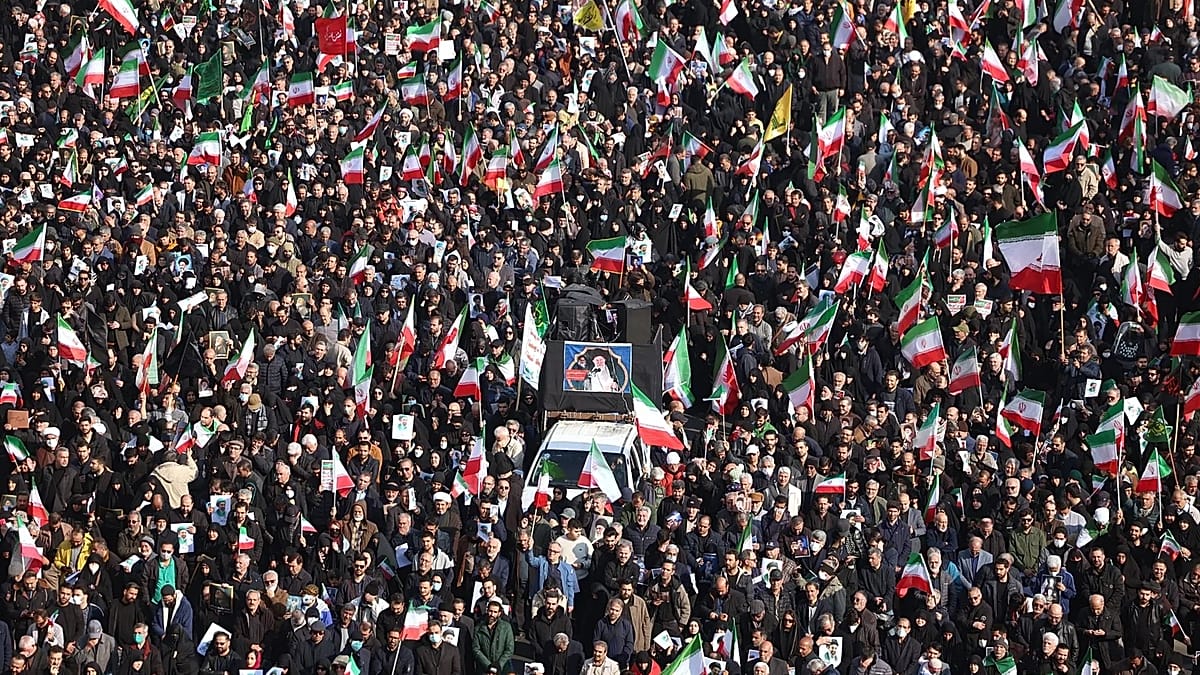
The story's immediacy stems from these tools' ability to democratize intelligence. Open-source 3D globes, shared on platforms like X (formerly Twitter), amplify user-generated analyses, with posts from geospatial experts tagging #IranWar and #MiddleEastWarMap garnering millions of views. One viral thread from @GeoIntelWatch overlays pre-war baselines against current scans, highlighting a 15% expansion of polluted coastal zones since March 10's US-Iran war escalation. Euronews Turkish and Odatv reports confirm Tehran's resilience, with Iranian forces launching counter-strikes on US naval assets, further scattering debris. This real-time visualization shifts public perception from abstract casualty counts—now over 5,000 confirmed dead per Al Jazeera—to tangible planetary harm, forcing a reevaluation of the war's sustainability.
The Players
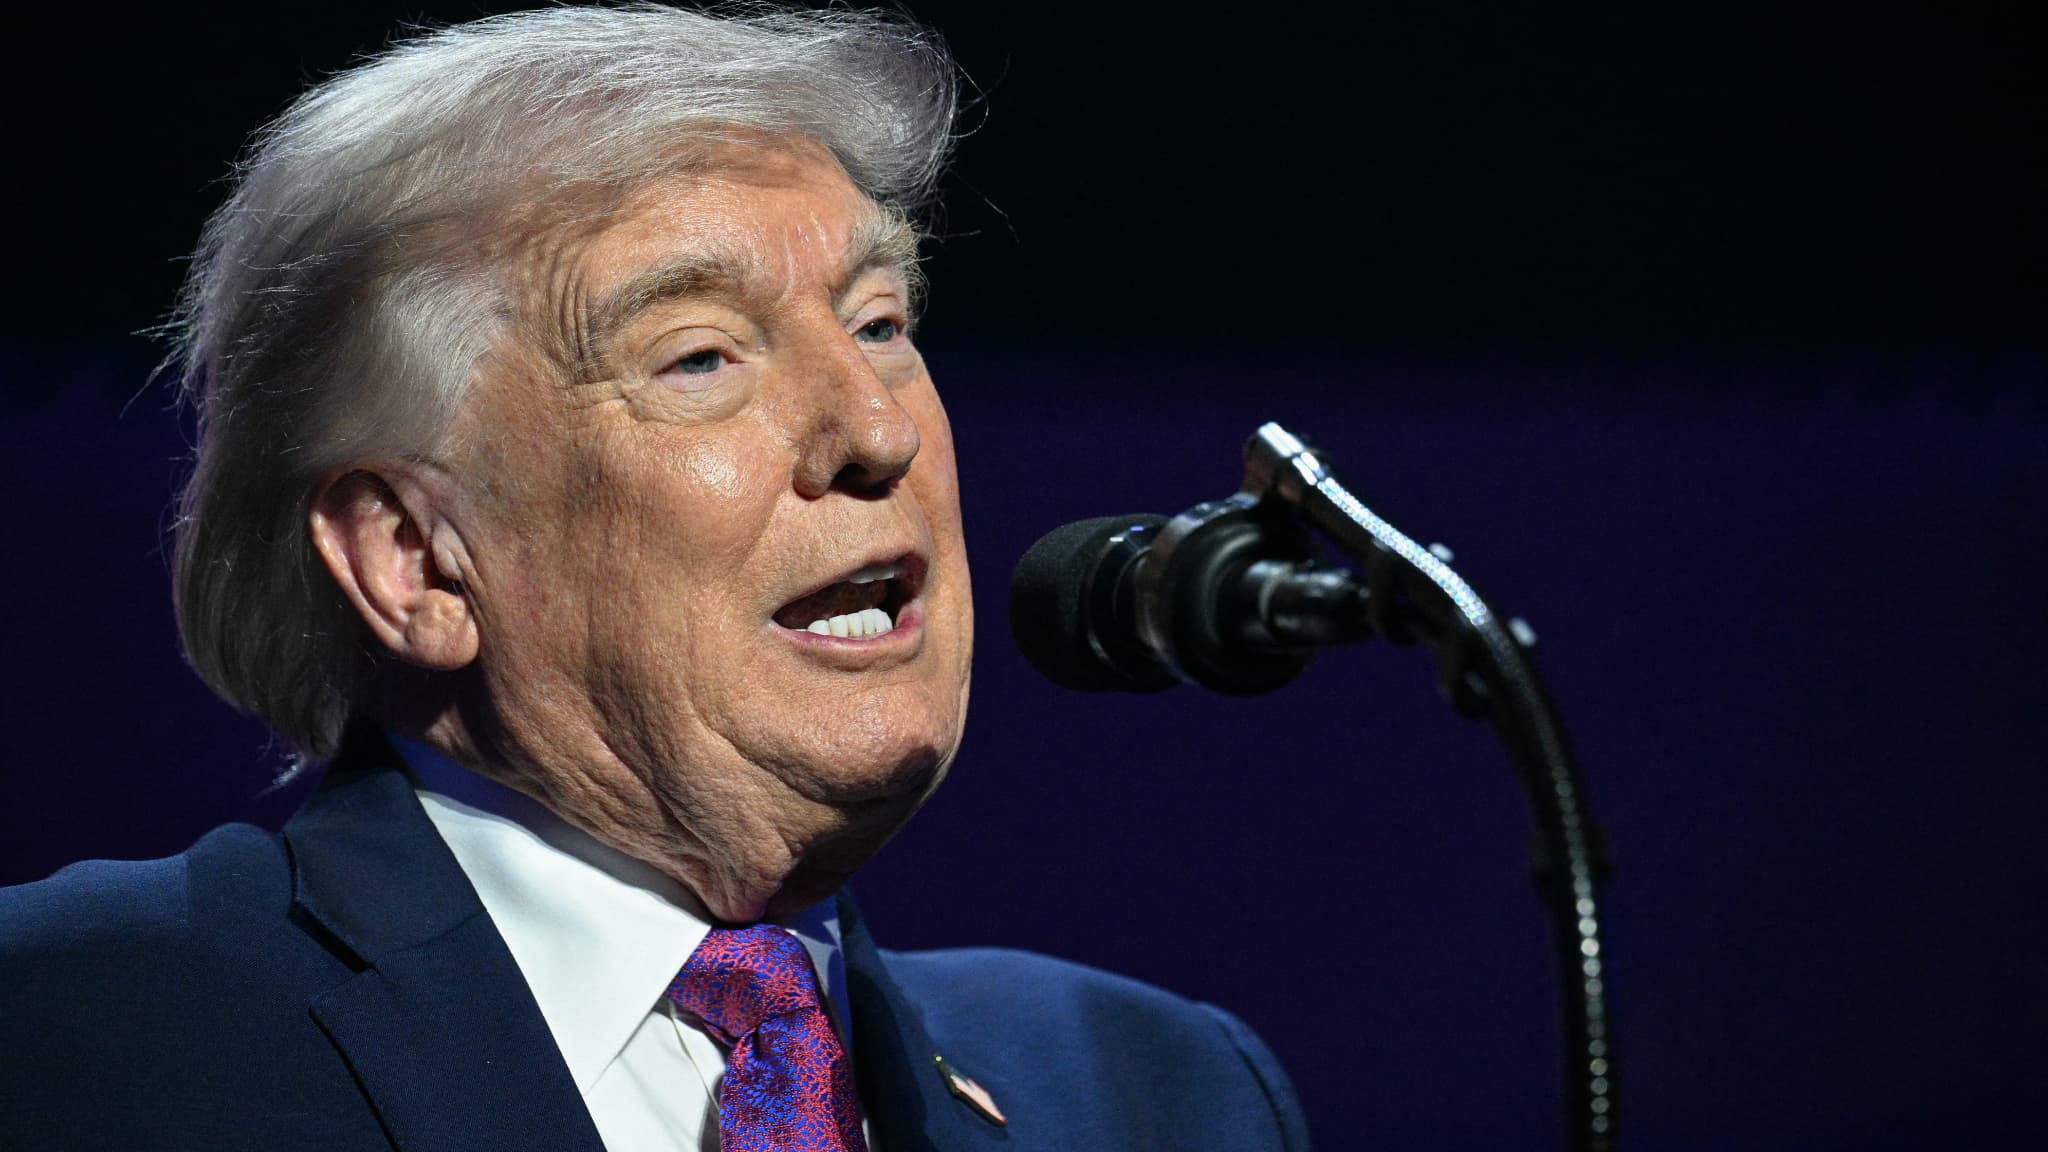
At the conflict's core are the US-Israel axis, led by President Donald Trump, whose administration frames the Iran war as a preemptive necessity against Tehran's nuclear ambitions and proxy militias. Trump's recent NATO threats, as noted in March 16 GDELT-tracked events, underscore motivations of regime change and energy dominance, with Israeli PM Benjamin Netanyahu aligning for security buffers post-October 2023 echoes. Their arsenal includes F-35 stealth strikes and carrier groups, but sources like Times of India dub it "Operation Epic Failure," citing Iranian air defenses downing three drones.
Iran, under Supreme Leader Ali Khamenei, positions itself as a defiant resistor, mobilizing IRGC naval forces to mine the Hormuz Strait—a chokehold on global energy. Motivations blend survival with ideological export of revolution, as Middle East Eye opines the war could fracture America's empire if prolonged. Proxy players like Houthis in Yemen amplify disruptions, launching Iran strikes on Saudi shipping.
Peripheral actors include Finland's President Alexander Stubb, urging ceasefires via India (Times of India), and NATO allies wary of entanglement. China's tacit support for Iran via oil purchases adds economic leverage, while Russia's arms supplies bolster Tehran's missile stocks. These players' interplay, visualized on Middle East war maps, reveals a multipolar chessboard where environmental fallout becomes a bargaining chip.
The Stakes
Politically, the Iran war risks unraveling US credibility if environmental blowback—pollution drifting to Gulf allies—alienates partners. Economically, Hormuz disruptions threaten $2 trillion in annual trade, per Dawn facts. Humanitarily, 3D tracking exposes 2 million displaced civilians in polluted zones, per UN estimates, with desalination failures risking cholera outbreaks.
The unique environmental nexus elevates stakes: historical missteps, like the 1991 Gulf War's oil fires, pale against current spills projected to release 1 million tons of hydrocarbons. This accelerates Middle East climate vulnerabilities—rising sea levels compounding dead zones—potentially displacing 20 million by 2040, per IPCC models adapted to war scenarios. Strategically, it undermines long-term victory; poisoned waters could spark intra-Gulf conflicts over resources.
Market Impact Data
Markets reel from the Iran war's supply shocks. Brent crude surged 8% to $92/barrel post-March 16's "US-Israeli War in Iran" critical event, with WTI at $88. The March 15 "Iran War Threatens Supply Chains" triggered a 5% Dow drop, erasing $1.2 trillion in value. Recent timeline: March 16 "US/Israel-Iran War Day 17: Trump Threatens NATO" (HIGH impact) saw Nasdaq futures dip 3%; March 13 Kharg Island strikes spiked volatility (VIX +12%). Airlines like Emirates lost 15% market cap amid cancellations; energy giants ExxonMobil gained 7% on scarcity bets.
Global stocks face volatility: European indices fell 4% on Hormuz fears, while safe-havens like gold hit $2,650/oz.
Catalyst AI Market Prediction
Powered by The World Now's Catalyst Engine, AI models forecast a 10-20% oil price spike within 30 days from environmental disruptions in Hormuz shipping lanes—Brent to $105-115/barrel, WTI $100-110. Stock volatility intensifies: S&P 500 -5-8%, Nasdaq -7-10% on tech-supply chains; energy sector +15-25%. Broader ripples include Euro Stoxx 50 -6%, with gold +10% to $2,900. These projections factor 3D-tracked spills reducing output by 2 million bpd, triggering OPEC+ responses.
Predictions powered by Catalyst AI — Market Predictions. Track real-time AI predictions for 28+ assets. For live Global Risk Index updates on the Iran war impacts, visit our dashboard.
Looking Ahead
The Iran war's trajectory hinges on next Iran strikes: escalation if Trump meets his "end soon" deadline (Odatv), or de-escalation via Stubb's ceasefire push. Scenarios include expanded alliances—Iran-Russia-China axis—or US ground ops by April. Key dates: March 20 NATO summit; April 1 OPEC meeting. Long-term, 3D tracking predicts humanitarian crises from climate-amplified fallout, urging diplomatic interventions. Historical parallels (2026-01-14 Iran readiness amid Trump warnings; 02-26 US warship moves) warn of quagmires, but tech-driven awareness could catalyze peace. Stay informed with our Global Conflict Map — Live Tracking for interactive Middle East war map views of the Iran war.
This is a developing story and will be updated as more information becomes available.