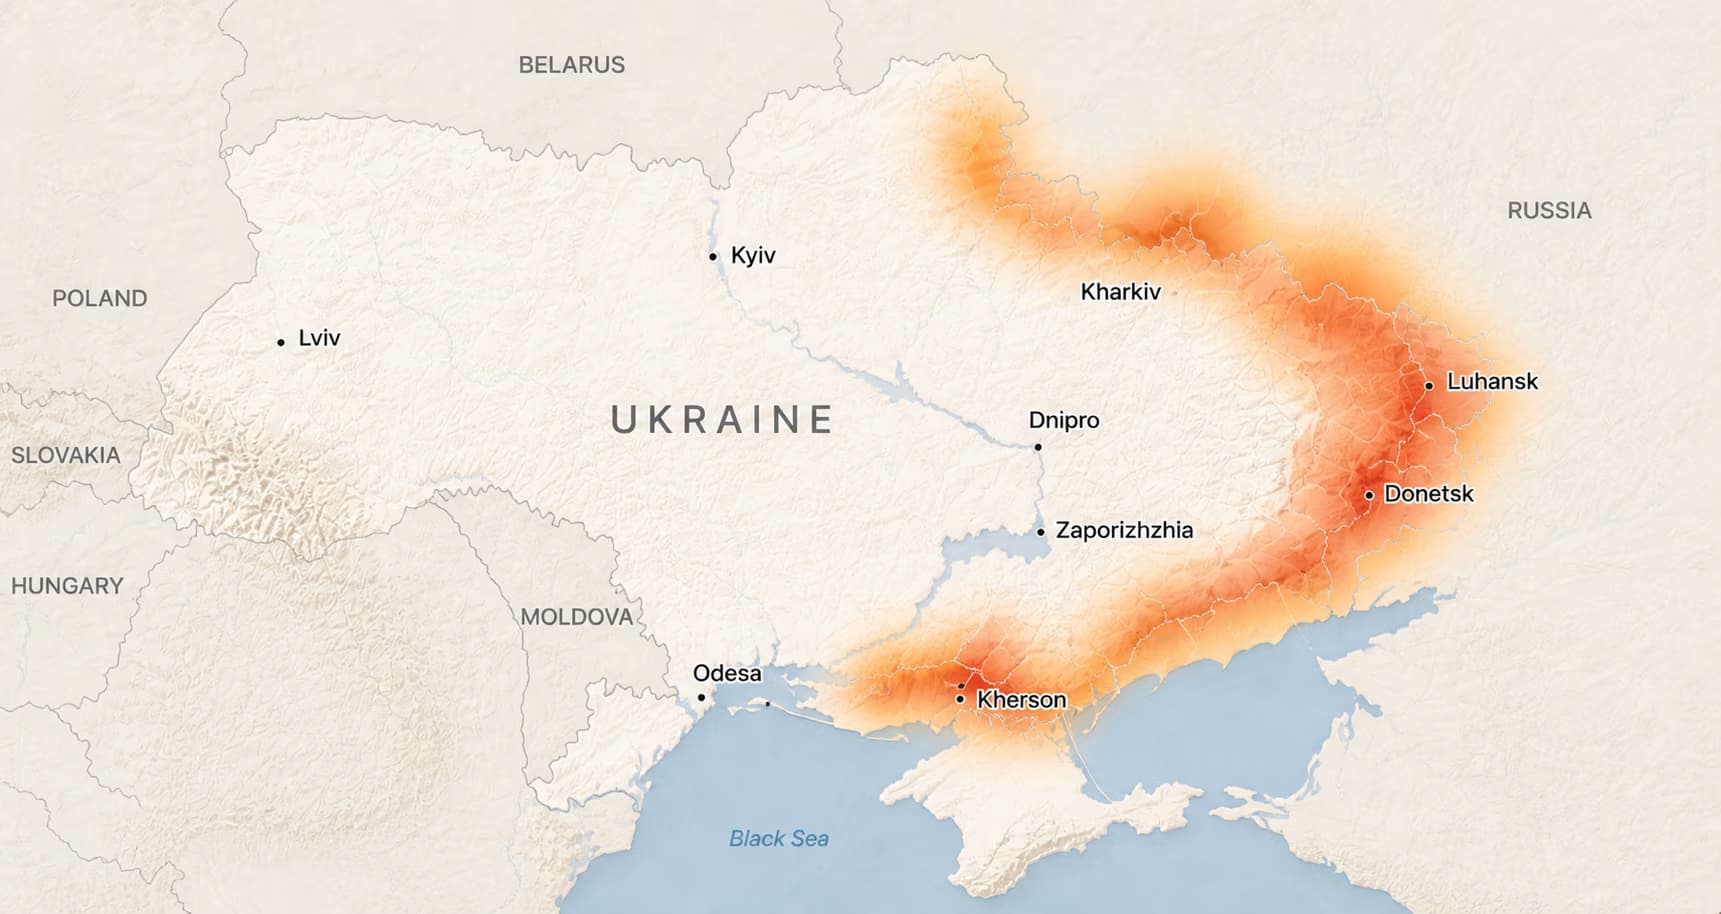
Tactical Map
Recent Activity
12 events- 10m ago
Ukraine · Drone strike
- 2h ago
Ukraine · Troop movement
- 4h ago
Ukraine · Drone strike
- 4h ago
Ukraine · Troop movement
Track the Russia–Ukraine war in real time. This page monitors every classified conflict event in Ukraine — strikes, military operations, and front-line developments — and connects them to global market impact through the Catalyst intelligence layer.
Tactical Map
Recent Activity
12 eventsUkraine · Drone strike
Ukraine · Troop movement
Ukraine · Drone strike
Ukraine · Troop movement
Global Risk Index
Live75
EXTREME
5 pts vs yesterday
AI Insight
Drone warfare escalation suggests a shift toward infrastructure targeting in Eastern Ukraine within the next 72 hours.
Confidence: High
Market Impact
Live Event Timeline
LiveAuto-updatingBriefing
Russia claims it struck additional vessels carrying weapons destined for Ukraine.
Type
Location
Severity
Updated
What to Watch
Increased drone strikes in Kharkiv and Sumy oblasts
Possible escalation in Donbas front
NATO response signals pending
Critical infrastructure at elevated risk
Related trackers
Current Wars
All active wars and armed conflicts worldwide.
Global Conflict Map
Live wars, strikes, and geopolitical escalation hotspots.
WW3 Map
Conflict escalation risk across nuclear-armed states.
Doomsday Clock
Real-time global risk scoring and existential threat tracking.
Wheat Predictions
AI-powered wheat price forecasts affected by Ukraine grain exports.
Oil Predictions
Energy market impact from the war and sanctions regime.
About this tracker
Russia's full-scale invasion of Ukraine on February 24, 2022 triggered the largest conventional war in Europe since World War II. What began as a rapid assault on Kyiv — with Russian forces advancing from Belarus, Crimea, and the Donbas simultaneously — quickly evolved into a grinding war of attrition as Ukrainian defenses held in key areas and Russia was forced to retreat from the north.
The war has passed through several distinct phases. The initial multi-axis invasion (February-March 2022) aimed at toppling the Ukrainian government within days. After that failed, Russia concentrated on the Donbas campaign, seeking to control the Donetsk and Luhansk oblasts through slow, artillery-heavy advances. Ukraine's Kharkiv and Kherson counteroffensives in late 2022 recaptured significant territory and demonstrated that the war's trajectory could shift. The 2023 Ukrainian counteroffensive made limited progress against deeply entrenched Russian defenses, highlighting the challenges of breaching layered minefields and fortifications.
By 2024-2025, the conflict settled into a positional war characterized by drone warfare at unprecedented scale, electronic warfare dominance, and incremental territorial changes measured in kilometers rather than provinces. Both sides have suffered enormous casualties — hundreds of thousands killed and wounded — and the war has consumed vast quantities of ammunition, armored vehicles, and military equipment. Ukraine's cross-border incursion into Russia's Kursk Oblast in August 2024 represented a dramatic escalation in the war's geographic scope.
Track the latest developments on our live map above, see the broader conflict context on the global conflict map, and monitor how the war affects markets through the Catalyst platform.
The Russia-Ukraine war has fundamentally altered the international order in ways that will persist long after the fighting ends. NATO has expanded to include Finland (2023) and Sweden (2024), adding over 1,300 kilometers of border with Russia and significantly strengthening the alliance's Nordic flank. European defense spending has surged, with Germany announcing a 100 billion euro special fund for its military — a dramatic break from decades of underinvestment.
The war has accelerated the decoupling of the European and Russian economies. Europe has largely eliminated its dependence on Russian natural gas, which previously accounted for roughly 40% of EU gas imports. The Nord Stream pipeline sabotage in September 2022 physically destroyed the infrastructure that had underpinned the energy relationship. This decoupling has forced Europe to source energy from the United States (LNG), Norway, and the Middle East, reshaping global energy trade flows.
The sanctions regime imposed on Russia is the most comprehensive ever applied to a major economy. It includes the freezing of approximately $300 billion in Russian central bank reserves, disconnection of major Russian banks from SWIFT, export controls on advanced technology, and restrictions on Russian oil and gas revenue. These sanctions have created a precedent that demonstrates financial infrastructure itself can be weaponized — a development that has accelerated de-dollarization discussions among BRICS nations.
The war has also deepened the Russia-China partnership, pushing Moscow closer to Beijing economically and diplomatically. Russia now sells significant volumes of oil and gas to China at discounted prices, and trade between the two countries has reached record levels. This emerging axis, while not a formal alliance, represents a strategic alignment that Western policymakers view as a long-term challenge to the existing international order. Monitor these geopolitical dynamics on our WW3 risk map and Doomsday Clock tracker.
The economic consequences of the Russia-Ukraine war extend far beyond the two belligerents. Global food security was immediately threatened because Ukraine and Russia together account for roughly 30% of global wheat exports, 20% of corn exports, and significant shares of barley, sunflower oil, and fertilizer production. The blockade of Ukrainian Black Sea ports in 2022 prevented grain shipments to food-import-dependent nations across Africa, the Middle East, and Asia, contributing to food price inflation and hunger in some of the world's poorest countries.
The Black Sea Grain Initiative, brokered by Turkey and the UN in July 2022, temporarily restored some Ukrainian grain exports before Russia withdrew in July 2023. Ukraine has since established alternative export corridors, but the war continues to disrupt agricultural production through direct destruction of farmland, mining of agricultural areas, and damage to storage and transportation infrastructure. Track wheat and grain market impacts on our wheat prediction page.
Energy markets experienced their most volatile period since the 1970s oil crisis. European natural gas prices briefly reached 10 times their pre-war levels. While prices have since normalized as Europe secured alternative supplies and reduced consumption, the structural shift away from Russian energy has permanently increased costs for European industry. Oil markets have been affected by the G7 price cap on Russian crude, sanctions on Russian oil products, and the rerouting of Russian oil exports from Europe to Asia.
Defense industry has boomed as nations rush to replenish stocks donated to Ukraine and expand their own military capabilities. Ammunition production across NATO countries has ramped up dramatically, with the EU targeting 2 million artillery shells per year. Defense contractor stocks have significantly outperformed broader markets since the invasion began. Meanwhile, the war has driven innovation in drone technology, electronic warfare, and autonomous systems that will shape military procurement for decades. See defense sector and commodity market analysis on our Catalyst platform.
The Russia-Ukraine war has brought nuclear risk to its highest level since the Cuban Missile Crisis. Russia possesses approximately 5,580 nuclear warheads — the world's largest arsenal — and has repeatedly referenced its nuclear doctrine in the context of the war. President Putin's early warning that any interference would face "consequences you have never seen in your history" set the tone for nuclear signaling that has continued throughout the conflict.
Russia's nuclear doctrine formally permits the use of nuclear weapons in response to aggression threatening the existence of the state, conventional aggression threatening nuclear deterrent forces, or nuclear attack. The question of whether Ukraine's cross-border incursion into Kursk Oblast or sustained strikes on Russian territory with Western weapons meets these thresholds has been a source of deliberate ambiguity. In November 2024, Russia updated its nuclear doctrine to explicitly state that aggression by a non-nuclear state supported by a nuclear power could be treated as a joint attack — language widely interpreted as targeting Ukraine and its Western backers.
The war also raised concerns about nuclear facility safety. The Zaporizhzhia Nuclear Power Plant — Europe's largest — has been occupied by Russian forces and subjected to military activity in its vicinity, raising fears of a radiological incident. The IAEA has maintained a permanent presence at the plant and has repeatedly warned of the dangers posed by military operations near nuclear facilities.
The Bulletin of the Atomic Scientists moved the Doomsday Clock to 90 seconds to midnight in January 2023, the closest it has ever been, citing the Ukraine war and nuclear risk as primary factors. The World Now's real-time Doomsday Clock tracker extends this assessment with continuous risk scoring, and the Global Risk Index weights nuclear posture changes as a key component of the conflict risk dimension.
Frequently Asked Questions
Yes, the Russia-Ukraine war is still ongoing as of 2026. It remains the largest active conventional war in the world, with fighting concentrated along a roughly 1,000-kilometer front line in eastern and southern Ukraine. The war has evolved into a positional conflict characterized by drone warfare, electronic warfare, and gradual territorial changes, with neither side achieving a decisive military breakthrough.
Neither side has achieved a decisive military victory. Russia controls portions of the Donetsk, Luhansk, Zaporizhzhia, and Kherson oblasts, as well as Crimea. Ukraine has held the majority of its territory and conducted successful counteroffensives. The war has become a war of attrition where industrial capacity, manpower reserves, and international support are the determining factors. The situation on the ground is tracked in real time on our live map above.
Ukraine and Russia together produce roughly 30% of global wheat exports. The war disrupted grain shipments through the Black Sea, contributing to food price inflation worldwide. While alternative export corridors have partially restored Ukrainian grain exports, the war continues to affect agricultural production through farmland destruction, mining, and infrastructure damage. Track wheat price impacts on our Catalyst asset page for wheat.
The Russia-Ukraine war carries escalation risks because it involves a nuclear-armed state (Russia) in combat against a country receiving extensive military support from NATO members. Potential escalation triggers include accidental strikes on NATO territory, direct NATO-Russia military incidents, or Russian use of tactical nuclear weapons. However, both NATO and Russia have sought to manage escalation risks through careful signaling and established de-confliction channels. Monitor escalation risk on our WW3 map and Doomsday Clock tracker.
We aggregate conflict event data from multiple verified intelligence sources in real time. Events in Ukraine are classified by type (war, conflict, strike), severity (low to critical), and precise geographic location. The system clusters events to identify active front-line zones and hotspots, and the Catalyst platform connects military developments to their market impact on energy, grain, defense, and safe-haven assets.
Explore next
Last updated 7/30/2026, 5:49:23 PM